# Measuring Client-Side JavaScript Performance
## Monitoring a client !~ Monitoring a server
- Timing for each request
- Values reveal load
- Values aggregate over time
- Values can be compared
- Servers can self-regulate
- Insight into memory
## How do we measure client JS performance?
~~~js
var start = Date.now();
func();
var time = Date.now() - start;
console.log('func took', time, 'ms');
~~~
## What about fine-grained measurements?
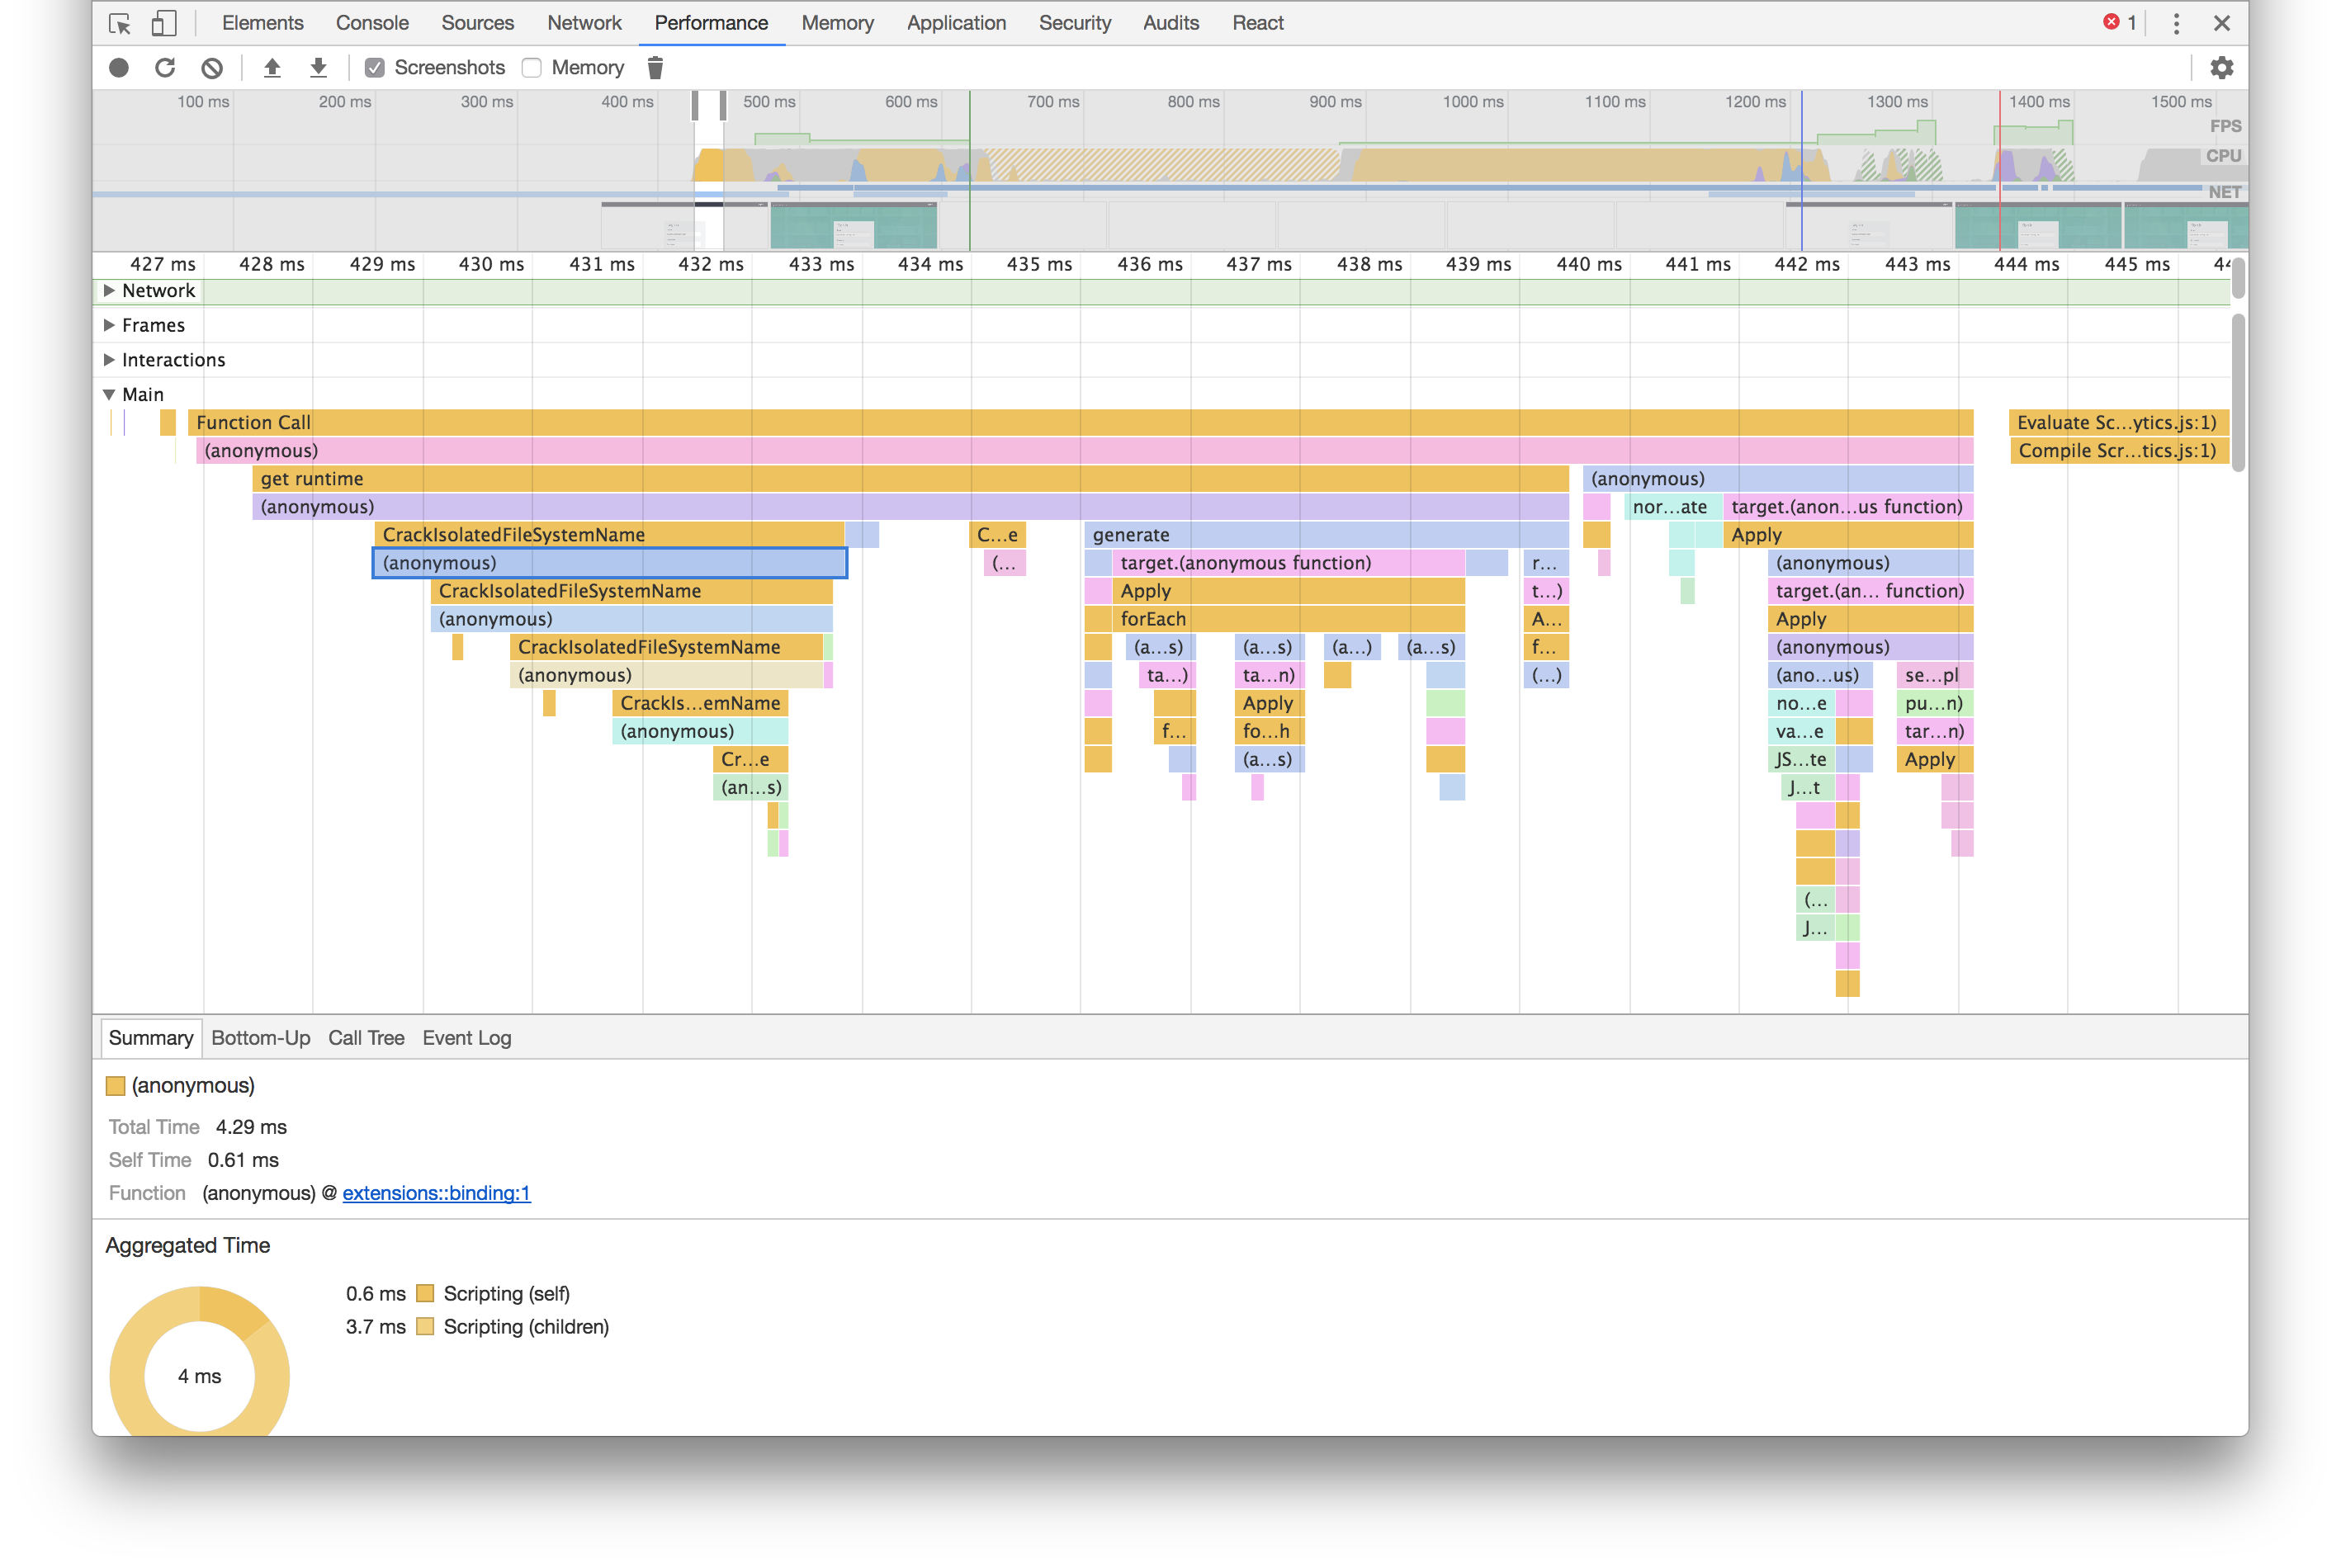
## Performance in devTools

## Performance API
~~~js
performance.mark("func-start");
func();
performance.mark("func-end");
// Make some [globally-spaced] marks
// Measure between two different marks
performance.measure("func", "func-start", "func-end");
// Get all of the measures out.
var measures = performance.getEntriesByName("func");
// In this case there is only one.
var measure = measures[0];
console.log("func took", measure.duration, "ms")
~~~
[window.performance docs](https://developer.mozilla.org/en-US/docs/Web/API/Performance/measure)
## Performance API++
[performance-plus repo](https://github.com/andjosh/performance-plus)
- Handles <IE10 browser support
- Preserves Functional API
- Basic quantitative helpers
- Other goodies
## Performance API++
~~~js
perf.start("func");
func();
perf.end("func");
console.log("func took", perf.duration("func"), "ms");
~~~
### This is a bit opaque, how can we visualize?
- Setting thresholds and then warning
- Reporting warnings to ourselves
- Remote [User timings](https://developers.google.com/analytics/devguides/collection/analyticsjs/user-timings)
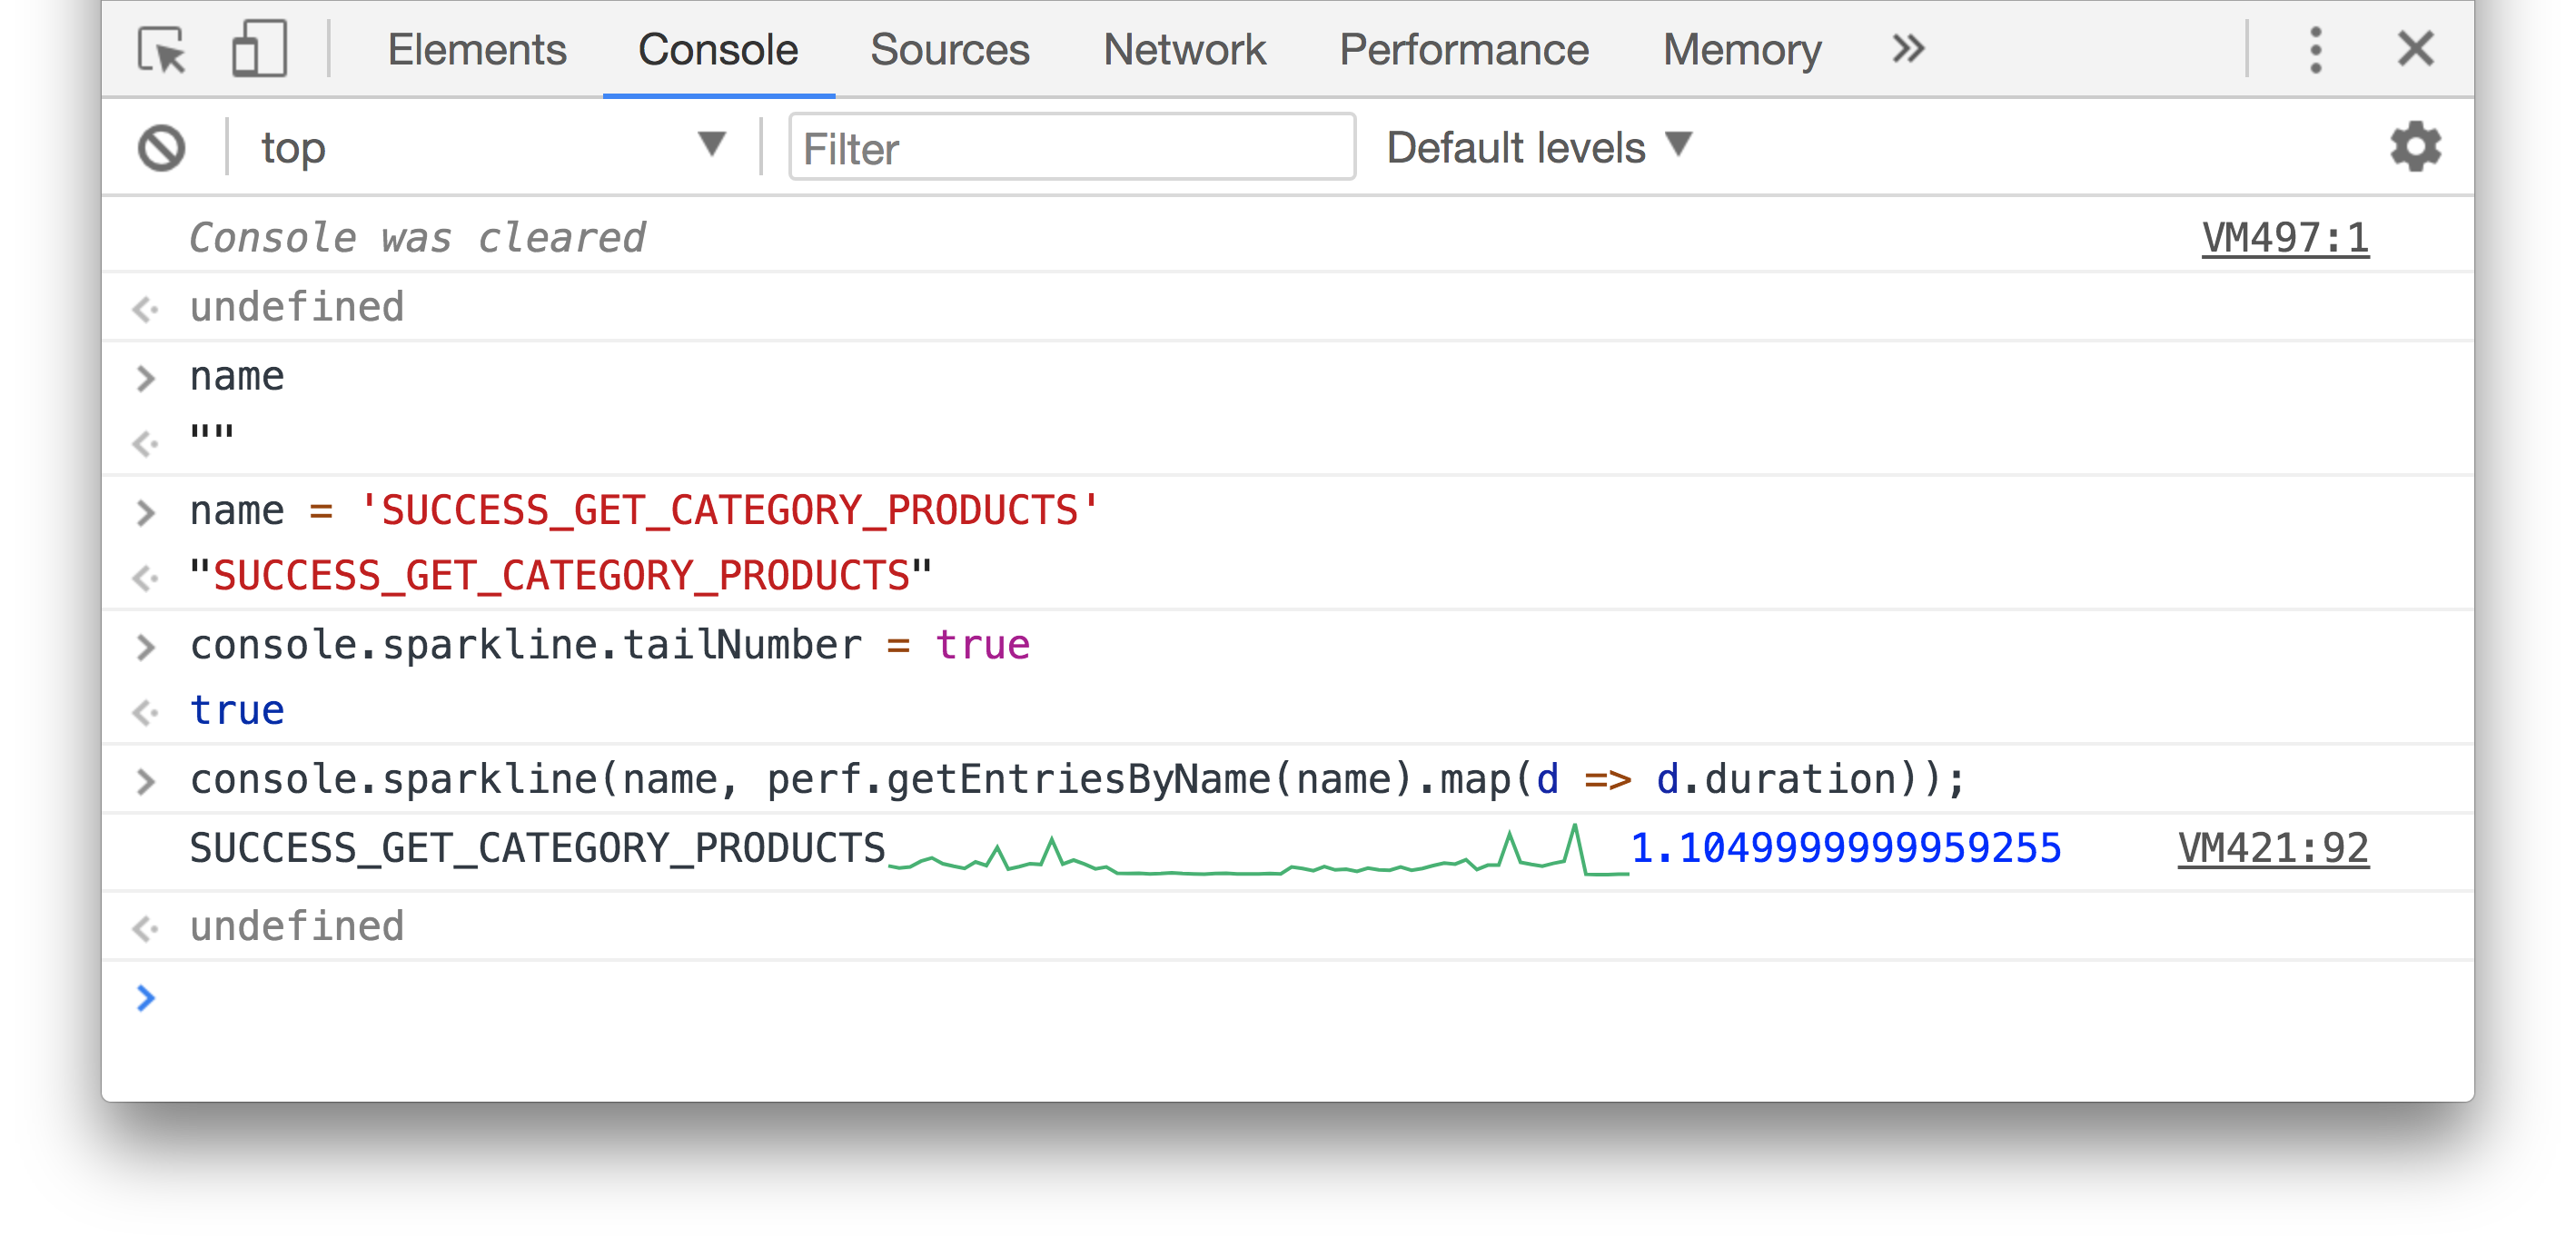
### Performance measurements & [console.sparkline](https://github.com/johan/console.sparkline)

## What affects the speed of your app?
## What affects the speed of your code?
- DOM access
- Other operations happening on the page
- Other operations happening on the domain
- Other operations happening on the client's browser
- Load happening on the client's machine
A single measurement/snapshot is not enough
## Aggregating measurements
~~~js
// ....
console.log("func has a sample size of",
perf.getEntriesByName("func").length);
console.log("func has a 95th percentile of",
perf.percentile("func", 0.95), "ms");
console.log("func averages", perf.mean("func"), "ms");
console.log("func has a standard deviation of",
perf.sdev("func"), "ms");
~~~
## Self-managing clients?
It's like responsive design, but for performance.
In [Redux middleware](https://redux.js.org/docs/advanced/Middleware.html), we can measure the time of actions
## Redux Performance warnings
~~~js
const THRESHOLD = 83; // ~ 5 animation frames
const perfMiddleware = store => next => action => {
perf.start(action.type);
let result = next(action);
perf.end(action.type);
const duration = perf.duration(action.type);
if (duration <= THRESHOLD) {
return result;
}
console.warn(`[perf] action ${action.type}`,
`took ${duration.toFixed(2)}ms`, {
mean: perf.mean(action.type),
sdev: perf.sdev(action.type),
samples: perf.getEntriesByName(action.type).length,
});
return result;
};
~~~
[redux-performance-plus repo](https://github.com/andjosh/redux-performance-plus)
## Self-throttling Redux
~~~js
let lag = 0;
perf.onFPS((fps) => { lag = 60 - fps; });
const THRESHOLD = 83; // ~ 5 animation frames
const perfMiddleware = store => next => action => {
const prevDuration = perf.duration(action.type);
if (!action._delayed
&& lag > 5 && prevDuration > THRESHOLD) {
action._delayed = lag;
setTimeout(() => {
store.dispatch(action);
}, Math.round(lag));
return store.getState();
}
perf.start(action.type);
let result = next(action);
perf.end(action.type);
return result;
};
~~~
[gist](https://gist.github.com/andjosh/383a08fec965a94ddd685c0345bcc605)
## A better approach
Degrade gracefully
- Remove ornaments
- Simplify animations
- Throttle event listeners
## Summary
- Collect fine-grained measures
- Aggregate and analyze data
- Make decisions based on that data
- Make your app aware of its performance
## Thanks!
https://www.andjosh.com/presents
https://officeluv.github.io